![]()
DataMineit Tackles Big Data using SAS®
Why wait over 21.5 hours for Proc SurveySelect when
DataMineit bootstraps in under 80 seconds?*
(download .pdf brochure)
NEW! – even faster, proprietary versions of OPDY and OPDN, the fastest SAS® algorithms published in peer reviewed statistics
journals for conducting Bootstraps, Permutation tests, and Sampling With and Without Replacement (download publications by
J.D. Opdyke, Senior Managing Director, DataMineit, LLC at http://www.DataMineIt.com/DMI_publications.htm).
NEW RESULTS: SAS-based OPDY and OPDN Algos
OVER 5 ORDERS OF MAGNITUDE FASTER THAN STATA, and
OVER ONE ORDER OF MAGNITUDE FASTER THAN MATLAB.
Contact J.D. Opdyke at JDOpdyke@DataMineit.com for additional details.
• FAST: Orders of Magnitude Faster than SAS® Procs
OPDY_Boot_FT1 and OPDN_Perm_FT1 are modular, compiled SAS® Macros that run exactly as do OPDY and OPDN
(but even faster). On large datasets, which is the only time that speed and scalability matter, OPDY_Boot_FT1 executes bootstraps
over 990x faster than the relevant “built-in” SAS® procedure (Proc SurveySelect). Similarly, OPDN_Perm_FT1 executes permutation
tests over 530x faster than Proc SurveySelect, over 400x faster than Proc NPAR1WAY (which crashes on datasets/strata less than
a tenth the size of those OPDN_Perm_FT1 can process), and over 5,970x faster than Proc Multtest
(that’s over 7 days vs. under 2 minutes).
• AFFORDABLE: Only Base SAS® is Required
• SCALABLE: Linear Runtime
Both OPDY_Boot_FT1 and OPDN_Perm_FT1 are truly scalable: their time complexity is linear, which is not the case for the relevant
SAS® Procedures.
• ROBUST: Theoretically Unlimited Dataset Size
The storage complexity (only memory, no I/O) of the algorithm is linear in the number of records in the largest stratum, not the size of
the dataset, so the algorithm can handle theoretically unlimited dataset size with any number of strata. The SAS® Procs either crash,
or become prohibitively slow as dataset/strata sizes increase.
• GENERALIZABLE: Multivariate Regression
Both algorithms are very generalizable. DataMineIt can modify OPDN_Perm_FT1 to conduct permutation tests using any sample
statistic, and for multivariate regression, DataMineIt has modified versions of OPDY_Boot_FT1 available to users for performing
bootstraps on econometric models.
CONTACT: Please contact J.D. Opdyke, Senior
Managing Director, DataMineit, LLC,
JDOpdyke@DataMineit.com or 617-943-6463 for more information about how
DataMineit can effectively
and efficiently leverage SAS®
for the “big data”
challenges your enterprise faces. *(.log files upon
request)
Finance/Market Risk Management Statistical Software
Sharpe Ratios are ubiquitous in financial analysis. Funds continuously are ranked by the Sharpe Ratio the world over. Yet these rankings never are accompanied by p-values or confidence intervals indicating the likelihood that observed differences between two funds' ratios actually are caused by true differences in performance as opposed to random sampling error. To be able to state that one fund's Sharpe ratio is larger than that of another, with 95% or 99% statistical confidence, would be highly valuable whenever one was performing a risk-adjusted performance assessment, via rankings of funds or a myriad of other approaches. Previous tests comparing Sharpe Ratios either were complex and computationally intensive, or relied on restrictive and highly unrealistic assumptions about the financial returns data being analyzed. But the statistical tests presented in the below Excel spreadsheets and SAS Programs relax these constraints, and are the first to provide such statistical tests, fully automated, on easily useable and universal platforms. Thus can financial analysts determine whether one fund's risk-adjusted performance truly is larger than that of another, with statistical significance.
Sharpe Ratios:
- Opdyke, J.D., (2006), Comparing Sharpe Ratios: So where are the p-values?
- preprint
SAS Program (email for 1-time password) - p-values from Sharpe Ratio comparisons and Mutual Fund Rankings (.pdf results)
- Excel Workbook (.xls- 1.4MB) (email for 1-time password) p-values from Sharpe Ratio comparisons and Mutual Fund Rankings
- JSM2006 PowerPoint Presentation
Permutation Test Statistical Software (download .pdf summary)
Permutation tests are often and increasingly the statistical test of choice when using data to answer business and research questions across an incredibly wide range of circumstances – literally wherever data samples are being used to address hypotheses. This is because permutation tests require minimal assumptions about the data being examined, yet often have statistical power equal to – and sometimes even greater than – their parametric counterparts that require stronger, and sometimes untenable data assumptions. And unlike many parametric and other nonparametric tests, the results of permutation tests (the p-values) are unbiased. Several statistical software vendors offer products with permutation test capabilities, but they are limited -- none can perform permutation tests within reasonable timeframes when samples are not very small and many tests are required. These products have prohibitive runtimes under these conditions (if they run at all) because the steps required to carry out a permutation test are computationally intensive.
-
What are permutation tests?
-
Permutation testing is a straightforward nonparametric resampling approach to statistically testing hypotheses about populations based on samples of data. “Resampling” indicates that the method relies on repeated sampling of the data samples, and “nonparametric” simply means that no assumptions are made about the distribution(s) of the population(s) from which the data samples were drawn. In contrast, inferences that are based on the values of parametric statistics assume that the population distribution(s) (or the values of the statistic themselves, like Z-scores from a Z-test) exactly follow a specific distribution precisely defined by a mathematical formula, like the standard normal distribution (a.k.a. the “bell” curve). But with real-world data this often is not the case (even when such assumptions are valid asymptotically – i.e. when sample sizes are infinitely large). There are many instances where the distributional assumptions required of parametric tests are invalid in practice, and often lead to incorrect inferences.
-
Rather than make specific distributional assumptions, a permutation test resamples (technically, reshuffles) the data samples at hand to actually construct the distribution of the test statistic under the null hypothesis. If the value of the test statistic based on the original samples is extreme relative to this distribution (i.e. if it falls far into the tail of the distribution), then the null hypothesis of “no difference between the populations” from which the data samples were drawn is rejected. The validity of a permutation test relies only on the data maintaining the property of exchangeability under the null hypothesis -- that is, the joint distribution of the data samples must remain invariant to permutations of the data subscripts. Thus, permutation tests maintain a wide applicability under a much broader range of data and research conditions than most parametric tests. In addition, they often have as much – and sometimes even more – statistical power than their parametric counterparts, and unlike many parametric and other nonparametric tests, the results of permutation tests (the p-values) are unbiased.
-
Until recently the major drawback of permutation tests has been their high computational demands, which have lead to prohibitive computer runtimes. This is due to the fact that the process of constructing the distribution of the test statistic under the null hypothesis, and consequently obtaining a p-value from a permutation test, requires a) calculating the test statistic based on the original data samples; b) pooling the samples being compared and randomly reshuffling the data points into samples of the original sizes; c) recalculating the test statistic based on these “fake” “permutation” samples; d) repeating steps b) and c) for every possible reshuffling combination of the data points; and e) comparing the distribution of test statistic values generated in d) to the single value based on the original samples in a) to obtain a p-value (the percentage of values in d) at least as large as the value obtained in a) is the one-tailed p-value). We know that the list of test statistic values generated in d) is the test statistic’s distribution under the null hypothesis because the reshuffling assigns the data points to the “permutation” samples completely at random. This ensures that, by definition, these samples will not systematically differ based on sample assignment, which is the null hypothesis.
-
The percentage of all the test statistic values (based on all the “permutation” samples) that are at least as large as the single value based on the original samples is the (one-tailed) p-value – the result of the permutation test. If few are as large, the p-value is small, and if it is smaller than the test's predetermined critical p-value (typically 5%, or α = 0.05), the null hypothesis of “no difference between the populations” underlying the samples is rejected with 95% (or 1 – α) statistical confidence. In other words, if it is as large or larger than 95% of the test statistic values based on the “permutation” samples, the value of the test statistic based on the original samples is considered to be so extreme relative to the distribution of the null hypothesis that it is assumed to be from another joint distribution where there is a difference between the populations underlying the samples. Consequently, the null hypothesis is rejected. If, however, the p-value is larger than α, the test fails to reject the null hypothesis.
-
Typically, the reshuffling/sampling process described above is modified somewhat because even small data samples have too many possible sample combinations to fully enumerate all of them when conducting a permutation test (for example, two samples, each with 30 observations, have 118,264,581,564,861,000 possible two-sample combinations of the data points). In these cases a sample of all the possible samples is drawn by performing the “permutation” reshuffling some large number of times (typically well over a thousand times). Without full enumeration the p-value will no longer be exact, but a confidence interval on the estimated p-value is easy to calculate as it is a simple percentage. The analyst can obtain the desired level of precision associated with the estimated p-value (i.e. tighten the confidence interval as needed) by simply increasing the number of “permutation” samples generated. The process described here of drawing a sample of samples, whereby the probability of drawing each and every possible sample combination is equal, and equal to one divided by the number of possible combinations (and thus, uniformly distributed), is called conventional Monte Carlo sampling.
-
However, even when relying on conventional Monte Carlo sampling rather than full enumeration, computer runtimes still can be prohibitive, especially if the data samples are not extremely small and many permutation tests are required. A number of commercial software packages are available that provide limited permutation test capabilities, but they all either abort or bog down under these conditions.
-
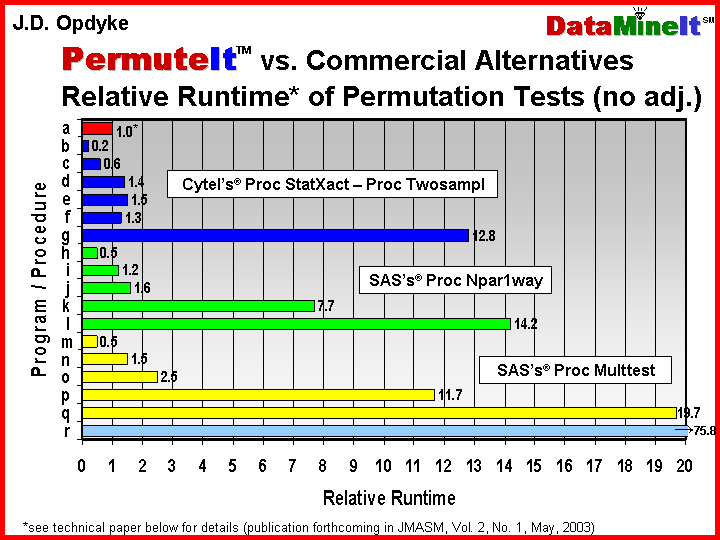
DataMineIt’s solution to the computational demands of permutation tests is PermuteItTM – statistical software that performs fast, two-sample permutation tests when one sample is large or both are moderately sized and many permutation tests must be performed (e.g. most multiple comparisons situations). PermuteItTM has been benchmarked against the available commercial alternatives (see table below or .pdf) and has relative runtimes often more than an order of magnitude faster under these conditions. This can make the difference between meeting deadlines, or missing them, when performing thousands of tests, and an hour’s runtime easily can become ten, twenty, or thirty hours. This disparity obviously becomes even more magnified when, as is the rule rather than the exception, analyses or reports need to be rerun due to the receipt of revised data; or the reprocessing of the input datasets; or any of the countless issues that arise when working with large volumes of data.
But
PermuteItTM not only
provides the speed that makes the appropriate application of permutation tests
possible where other software fails – it also provides increased precision in
the estimated p-values.
PermuteItTM uses a combination of algorithms that,
wherever possible, provide exact p-values based on full enumeration. When exact
inference is not possible, at the user’s request
PermuteItTM efficiently
attains variance reduction by increasing the number of permutation samples drawn
if the confidence interval contains the predetermined critical p-value of the
test. This provides a larger number of unambiguous test results in less time by
avoiding wasteful sampling. Some of the unique and powerful features of
PermuteItTM include:
·
the availability to the user of a wide range of test statistics
for performing permutation tests on continuous, count, and binary data, including: pooled-variance t-test;
separate-variance Behrens-Fisher t-test and joint tests for scale and location
coefficients using nonparametric combination methodology; permutation scale
test; Brownie et. al. “modified” t-test; skew-adjusted “modified” t-test
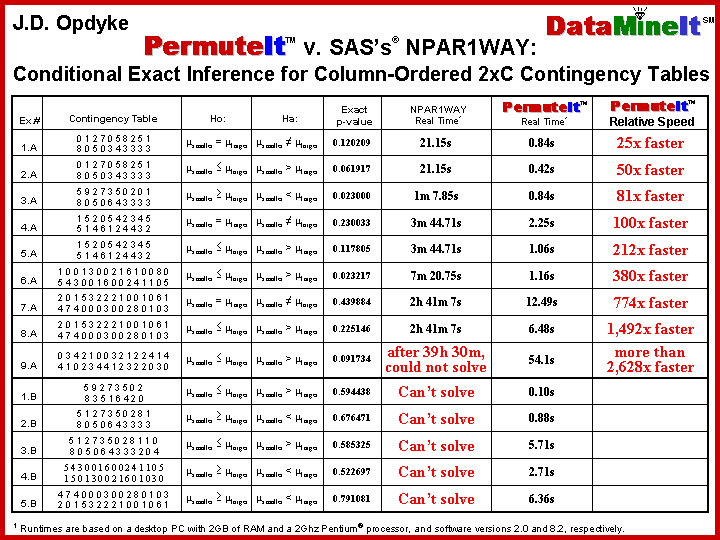
exact inference; Cochran-Armitage test; exact inference; Poisson normal-approximate test; Fisher’s exact test;
Freeman-Tukey double arcsine test
·
extremely fast exact inference (no confidence intervals –
just exact p-values) for most count data and high-frequency continuous data,
often several orders of magnitude faster than the most widely available
commercial software (see
table below or
.pdf)
· the availability to the user of a wide range of multiple testing procedures, including: Bonferroni, Sidak, Stepdown Bonferroni, Stepdown Sidak, Stepdown Bonferroni and Stepdown Sidak for discrete distributions, Hochberg Stepup, FDR, Dunnett’s one-step (for MCC under ANOVA assumptions), Single-step Permutation, Stepdown Permutation, Single-step and Stepdown Permutation for discrete distributions, Permutation-style adjustment of permutation p-values
·
efficient variance-reduction under
conventional Monte Carlo via
self-adjusting permutation sampling when confidence intervals contain the
predetermined critical value of the test
·
fast, efficient, and automatic
generation of all pairwise comparisons
·
shortest confidence intervals
under conventional Monte Carlo via a new
sampling optimization technique (see Opdyke,
Journal of Modern
Applied Statistical Methods, Vol. 2, No. 1, May, 2003, and related
conference
presentations -- .pps)
·
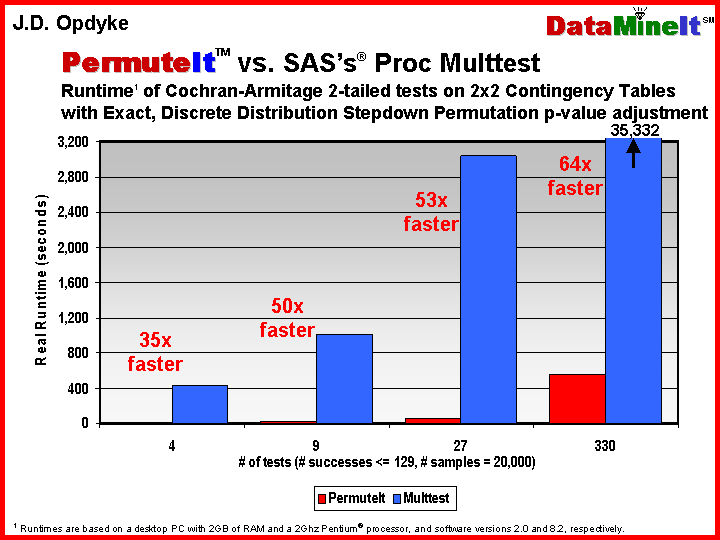
fast permutation-style p-value adjustments for multiple
comparisons (the code is actually designed to provide an additional speed
premium for these resampling-based multiple comparisons adjustments -- see table
below or .pdf)
· simultaneous permutation testing and permutation-style p-value adjustment, although for relatively few tests at a time (this capability is not even provided as a preprogrammed option with any other software currently on the market)
For Telecommunications, Pharmaceuticals, fMRI data, Financial Services, Clinical
Trials, Insurance, Bioinformatics, and just about any data rich industry where
large numbers of distributional null hypotheses need to be tested on samples
that are not extremely small and parametric assumptions are either uncertain or
inappropriate,
PermuteItTM
is the optimal, and only, solution.
DataMineIt has designed, benchmarked, and thoroughly tested the premier permutation test software on the statistical software market for moderate sample sizes and many tests. To learn more about how PermuteItTM can be used for your enterprise, and to obtain a demo version, please contact its author, J.D. Opdyke, Senior Managing Director, DataMineit, LLC, at JDOpdyke@DataMineit.com. Please include with your name relevant contact (email address, phone number, etc.) and background (company, title, etc.) information.